Request Demo

A Year In Review 2025

ARTIST MERCH EDITION

Umbrella Metrics

for industry
$9.90
Average $/Head
$21,078
Avg. Total Gross Merch Sales Per Show
Country
Genre With Most Shows
2,420
Avg. Show Attendance
K-Pop
Genre With Highest Avg. $/Head
517
Avg. # of Items Purchased Per Show
K-Pop
Genre With Highest Avg. Attendance
Average $/Head

For Industry

2025

$9.90

UK

£6.60

Canada

$11.40

Insight:

2024 saw a +14% increase in the industry average $/head. Part of this increase is due to the average item price increasing 9%. The percentage of fans buying merch also increased +1ppt.

Average $/Head

by top 15 genres
Average Gross Sales By Show

By Genre

Average $/Head

Top 5 Genres

K-Pop: $22.65

(Avg. $/Head)

Heavy Metal: $13.46

(Avg. $/Head)

Hip Hop/Rap: $13.29

(Avg. $/Head)

Pop: $12.55

(Avg. $/Head)

Alternative: $12.09

(Avg. $/Head)

Percentage Of Attendees Buy Merchandise

Broken Down By Genre

K-Pop continues to be a dominating genre for both sales and fan interest in merchandise. Heavy Metal, Metal, and Punk all saw a noticeable jump in 2024 with all rising to be in the top 10. Folk also jumped up form 13% in the prior yearto 21%, above Rock and Country.

Insight:
  • 20% of fans buy merchandise at concerts, comparable to prior year (21% in 2023)
  • Shows under 3k saw an increase in volume compared to prior years, up to 7ppt compared to 2023
  • Stadium attendance continues to show elevated percentage of fans buying merchandise, with small- and mid-cap sized attendance also seeing an increase from prior year
Show Breakdown By Attendance Grouping

For All Shows In 2024

26%
1-500
33%
501-1500
15%
1501-3000
8%
3001-5000
9%
5001-10k
5%
10001-15k
2%
15001-20k
3%
20001+
Average $/Head By Attendance Grouping

Top 5 Genres

Streaming VS Merchandise

Avg. Stream = $0.00318 & 1 Band Tee = $36

11,320

streams

=

1

band tees

Avg. Yearly Streaming Revenue

Based On Spotify Published Metrics*

$625

Avg. Nightly Merch Revenue

From A Single ShowIn 2024 (<1,500 Capacity)

$6,342

Percentage Of Total Gross Merch Sales

From The Top Selling 3 Items

63%

26%
1-500
33%
501-1500
Number Of Unique Items Brought Into A Show

Based On All atVenu Counts In Sheets

1
Las Vegas, NV

$/Head: $13.86

Avg. Attendance: 697

2
Las Vegas, NV

$/Head: $13.86

Avg. Attendance: 697

3
Las Vegas, NV

$/Head: $13.86

Avg. Attendance: 697

4
Las Vegas, NV

$/Head: $13.86

Avg. Attendance: 697

5
Las Vegas, NV

$/Head: $13.86

Avg. Attendance: 697

6
Las Vegas, NV

$/Head: $13.86

Avg. Attendance: 697

7
Las Vegas, NV

$/Head: $13.86

Avg. Attendance: 697

8
Las Vegas, NV

$/Head: $13.86

Avg. Attendance: 697

9
Las Vegas, NV

$/Head: $13.86

Avg. Attendance: 697

10
Las Vegas, NV

$/Head: $13.86

Avg. Attendance: 697

11
Las Vegas, NV

$/Head: $13.86

Avg. Attendance: 697

12
Las Vegas, NV

$/Head: $13.86

Avg. Attendance: 697

13
Las Vegas, NV

$/Head: $13.86

Avg. Attendance: 697

14
Las Vegas, NV

$/Head: $13.86

Avg. Attendance: 697

15
Las Vegas, NV

$/Head: $13.86

Avg. Attendance: 697

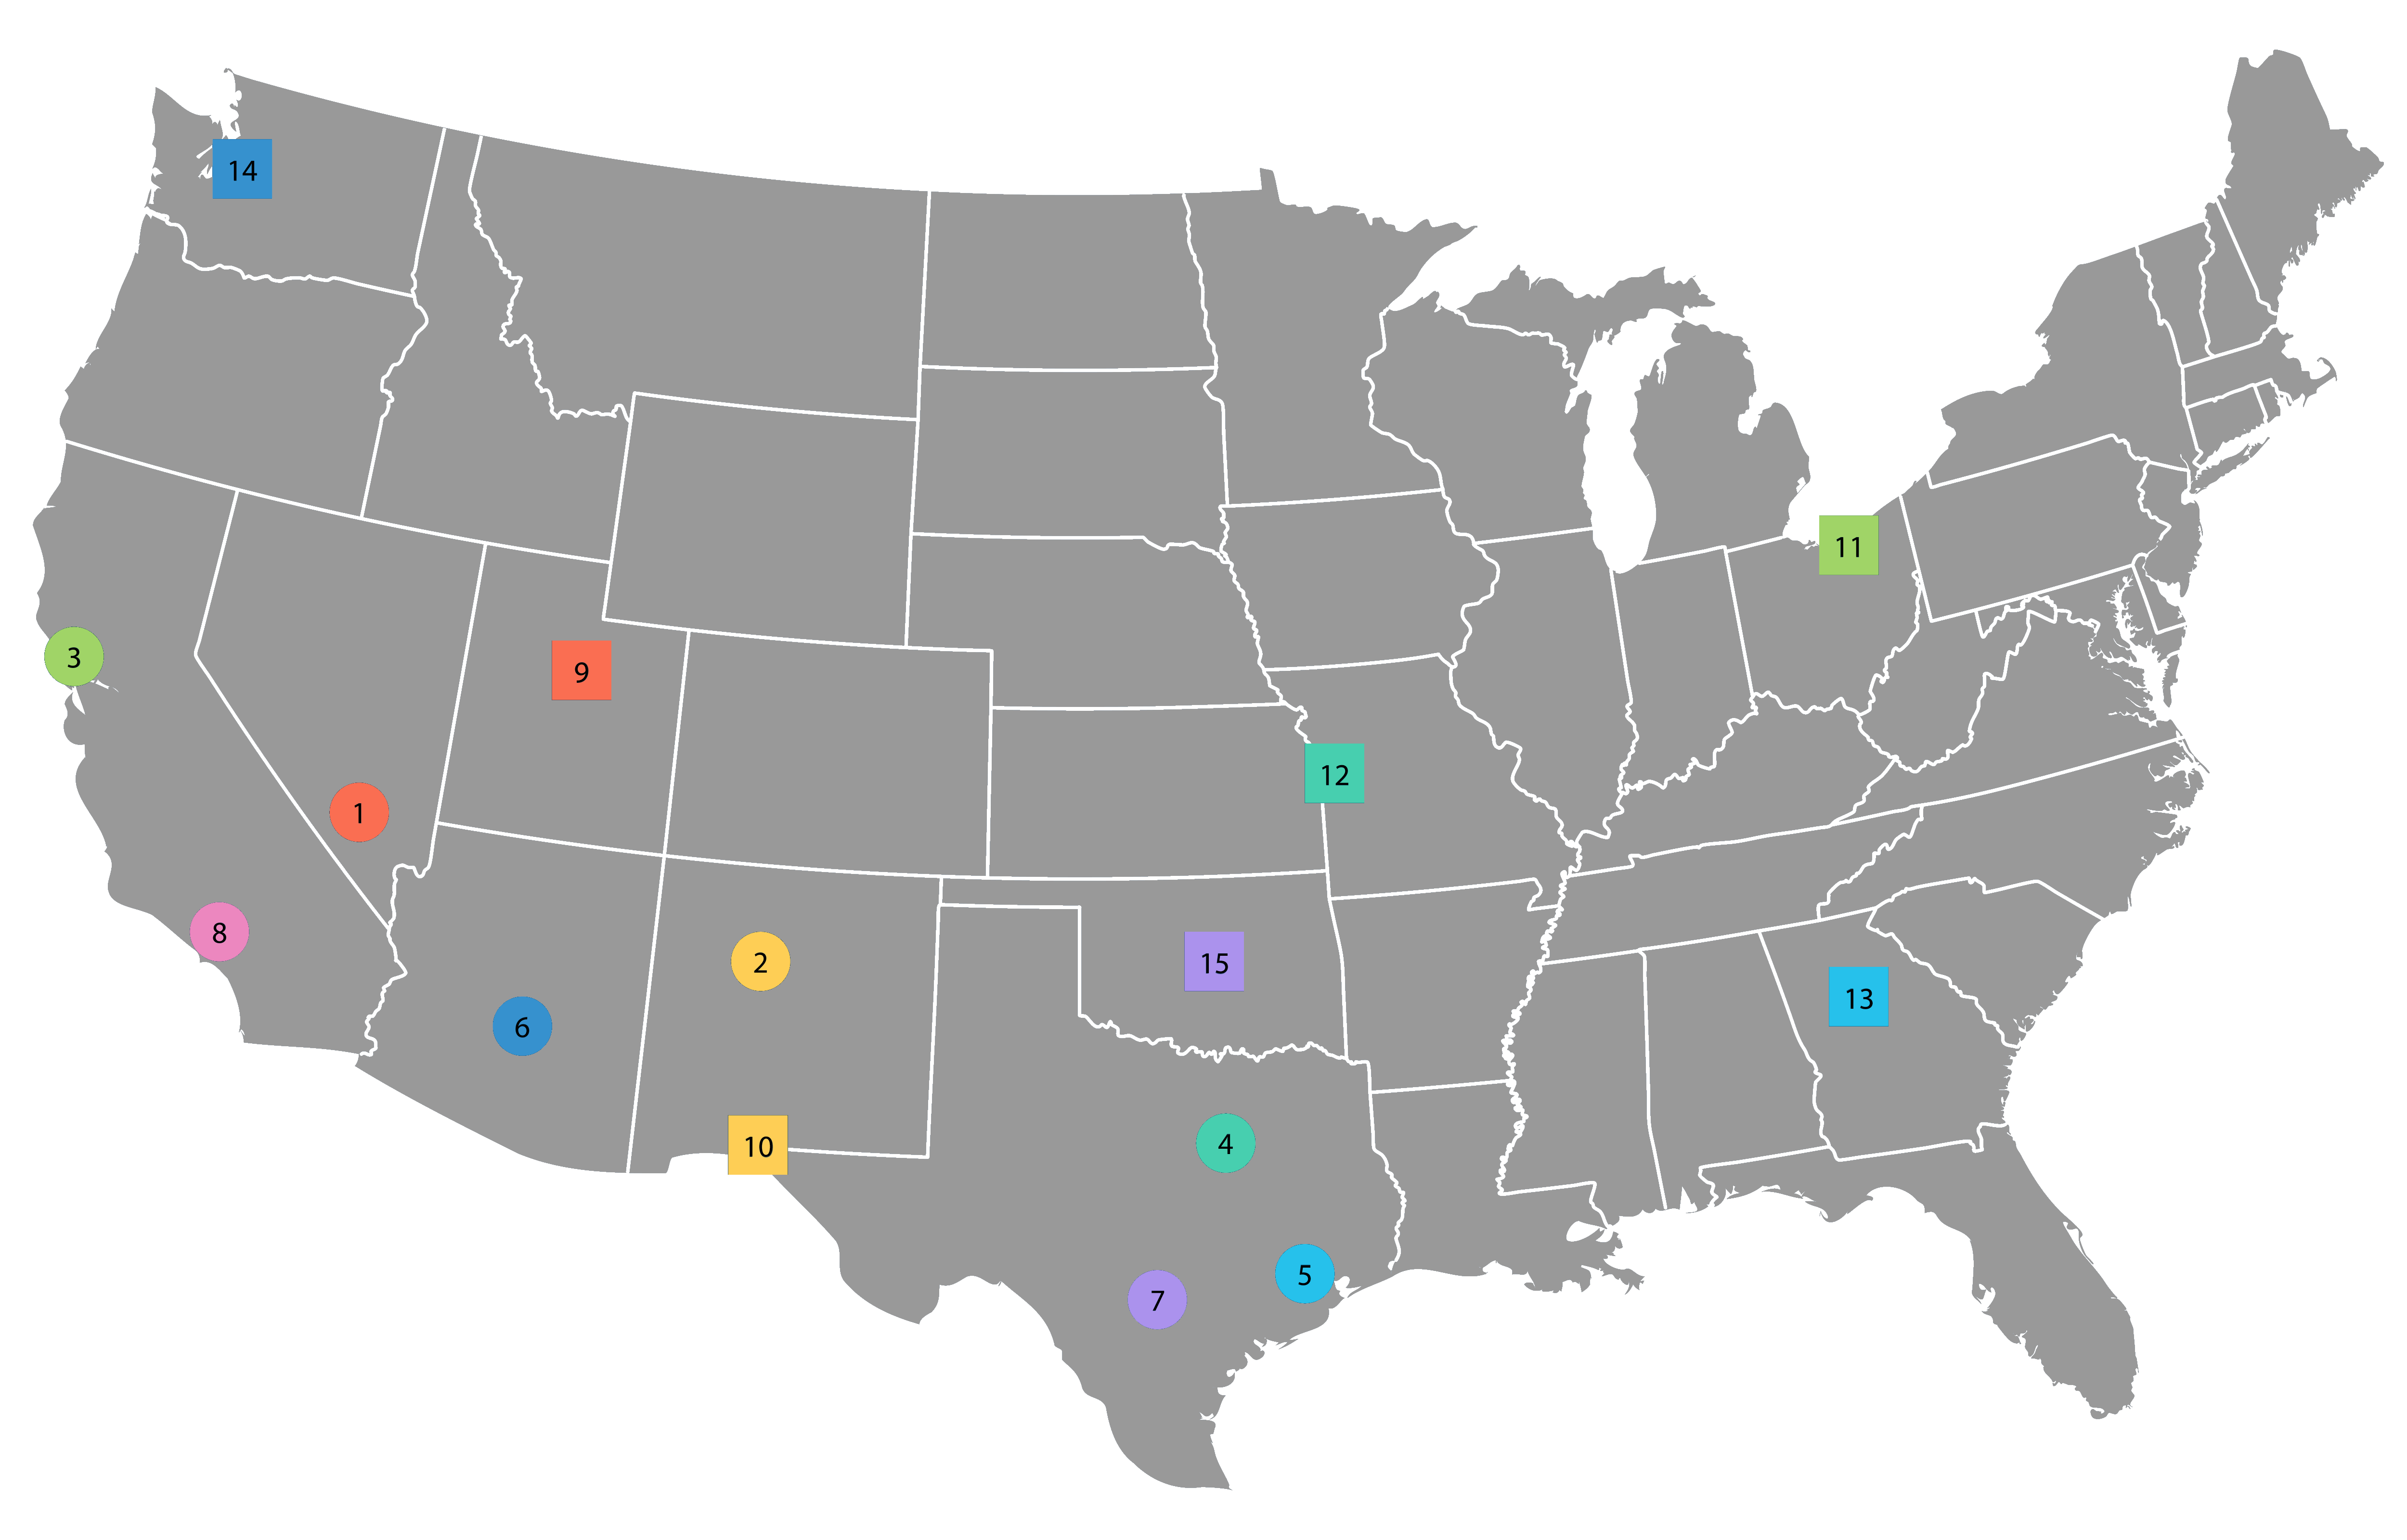
Rankings are determined based on settled atVenu shows from an artist account and taking the average $/head of all shows in that market. Cities with less than 100 shows are excluded. Phoenix, Dallas, Chicago and Detroit are a consolidation of surrounding cities and grouped as one market.

* Avg. Yearly Streaming Revenue per artist = total royalties distributed to artists / total artists on their platform ($5B / 8M)
Spotify published metrics can be found
here regarding the total royalties distributed to artists in 2020 ($5B+) and here for the number of estimated artists on their platform in 2020(~8M+). Our numbers are estimates and not official numbers from Spotify.

Top Selling Items

Of 2024

1

T-Shirt

$37.00

56% of all items sold

2

Heading

$37.00

6.5%

3

Heading

$37.00

5.5%

4

Heading

$37.00

3.5%

5

Heading

$37.00

3.4%

6

Heading

$37.00

2.5%

7

Heading

$37.00

2.3%

8

Heading

$37.00

2.2%

9

Heading

$37.00

2.1%

10

Heading

$37.00

1.6%

Top T-Shirt Colors

Of 2024

53%
Black
11%
White
4%
Natural/Tan
3%
Grey
3%
Red
3%
Blue
23%
All Others

Trends We're Seeing For 2025

  • Cashless: This is the new normal. Even compared to credit cards Tap To Pay for credit cards is more popular than inserting a chip or swiping.
  • Accessories: Depending on genre, specific accessory items are growing in popularity and making their way into the top 5 of items sold.
  • Streamlined Product Lines: Smaller product lines continue to show a higher average in sales per show than larger product lines. Less is more.