
Solutions
Industries
Resources
About
Venues increase merch per caps by making it easier to buy, not by raising prices: more selling points where fans gather, shorter lines at doors and set breaks, mobile ordering and suite service, a product line built around the top sellers, and stock moved to where demand is during the show. Then measure $/head show by show.
Read time:
8
minutes
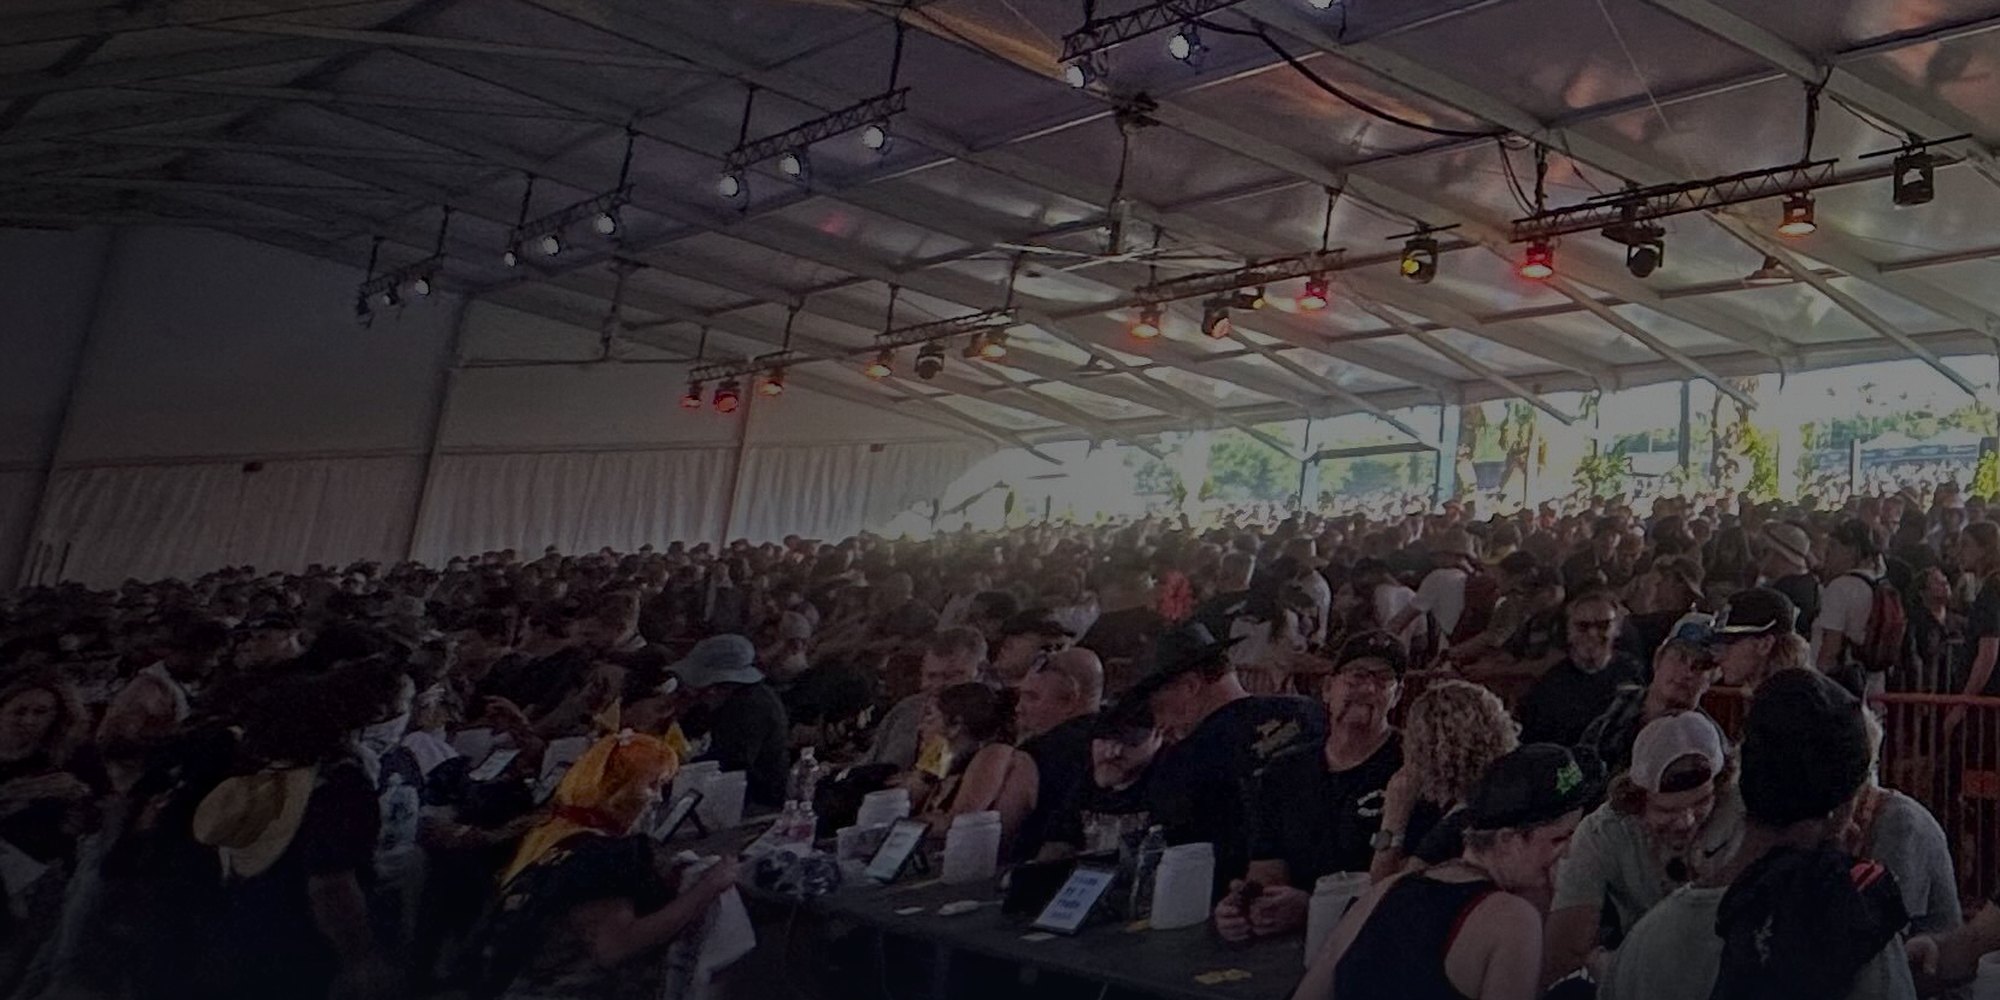
Venues increase merch per caps by making it easier to buy, not by raising prices: more selling points where fans gather, shorter lines at doors and set breaks, mobile ordering and suite service, a product line built around the top sellers, and stock moved to where demand is during the show. Then measure $/head show by show.
Merch per cap, often written $/head, is merchandise sales divided by attendance. It puts a small club and a sold-out amphitheater on the same scale, so you can compare shows of any size.
Merch $/head = Merch sales ÷ attendance
Multiply the two and you get $/head. Every tactic in this guide raises one or the other.
Source: atVenu Year in Review 2025, Artist Merch Edition.
Average spend per head has risen every year in atVenu's Year in Review, from $8.79 in 2023 to $10.24 in 2025, a 3% gain in 2025 alone, and the page's 2026 figure, for January 1 to September 30, is higher again at $10.33.
Average merch $/head by year
Bars are drawn to scale from zero. Years as labelled on the Year in Review page; 2026 covers January 1 to September 30.
Source: atVenu Year in Review 2025, Artist Merch Edition, average $/head by year, artist merchandise data.
The share of fans buying has barely moved: 20% in 2023 and 21% in each year since, including January 1 to September 30, 2026. That points to where the next gains are. atVenu's outlook for 2026 is that, with purchase rates this steady, growth will come from more buying moments, not just higher prices.
Yes. In 2025, shows under 3,000 capacity gained 10% to 17% in average $/head, while three of the four larger capacity groups slipped.
Average merch $/head by capacity group, 2025 compared with 2024
Bars share one scale starting from zero. Changes are as shown on the source page.
Source: atVenu Year in Review 2025, Artist Merch Edition, average $/head by capacity grouping, 2024 vs 2025.
In a small room, one well-placed stand is close to most of the crowd. In a bigger building, fans walk farther and choose between more lines, so the number and placement of selling points matter more. That may make the operating changes below matter most in the larger rooms where spend slipped.
The act on the bill moves per caps more than almost anything else. In 2025, K-Pop shows averaged $34.52 per head, about four times Country at $8.46. Plan stock and staffing for the genre in front of you, not the venue average.
Average merch $/head by genre, 2025, with change from 2024
Top 16 genres, sorted by 2025 average $/head. Bars are drawn to scale from zero.
Source: atVenu Year in Review 2025, Artist Merch Edition, average $/head by top 16 genres with year-over-year growth.
Market matters too. Los Angeles led atVenu's top 15 markets at $16.25 per head, followed by Cleveland at $14.94 and Dallas at $14.47.
Top 15 markets by average merch $/head
Source: atVenu Year in Review 2025, Artist Merch Edition. Rankings use the average $/head of settled atVenu shows from artist accounts in each market. Cities with fewer than 100 shows are excluded; Phoenix, Dallas, Chicago and Detroit combine surrounding cities into one market.
T-shirts lead by a wide margin: 56% of all items sold in 2025, at an average of $37 before tax. Black alone accounts for 51.83% of t-shirts sold.
Top five merch items by share of all items sold, 2025
Share of all items sold and average pre-tax price. Bars are drawn to scale from zero.
Source: atVenu Year in Review 2025, Artist Merch Edition, top selling items and top t-shirt colors of 2025.
The top three items produce 63% of gross merch sales. Yet product lines are often long: in atVenu's count of unique items brought into a show, the largest group, 41%, is 15 or more items. atVenu's 2026 outlook points the other way: smaller, curated product lines are outperforming larger catalogs, with higher per-head spend and faster decisions at the counter.
For a venue, that means every stand carries the best sellers in every size, and the long tail stays at the main stand.

Merchandise grows when buying gets easier. These seven changes do that, and each one raises either the share of fans buying or what each buyer spends.

Put stands at entrances, along the routes to bars and restrooms, and at the exits. In atVenu's measured dataset, adding merchandise selling locations was associated with a 13% increase in per-show gross sales.

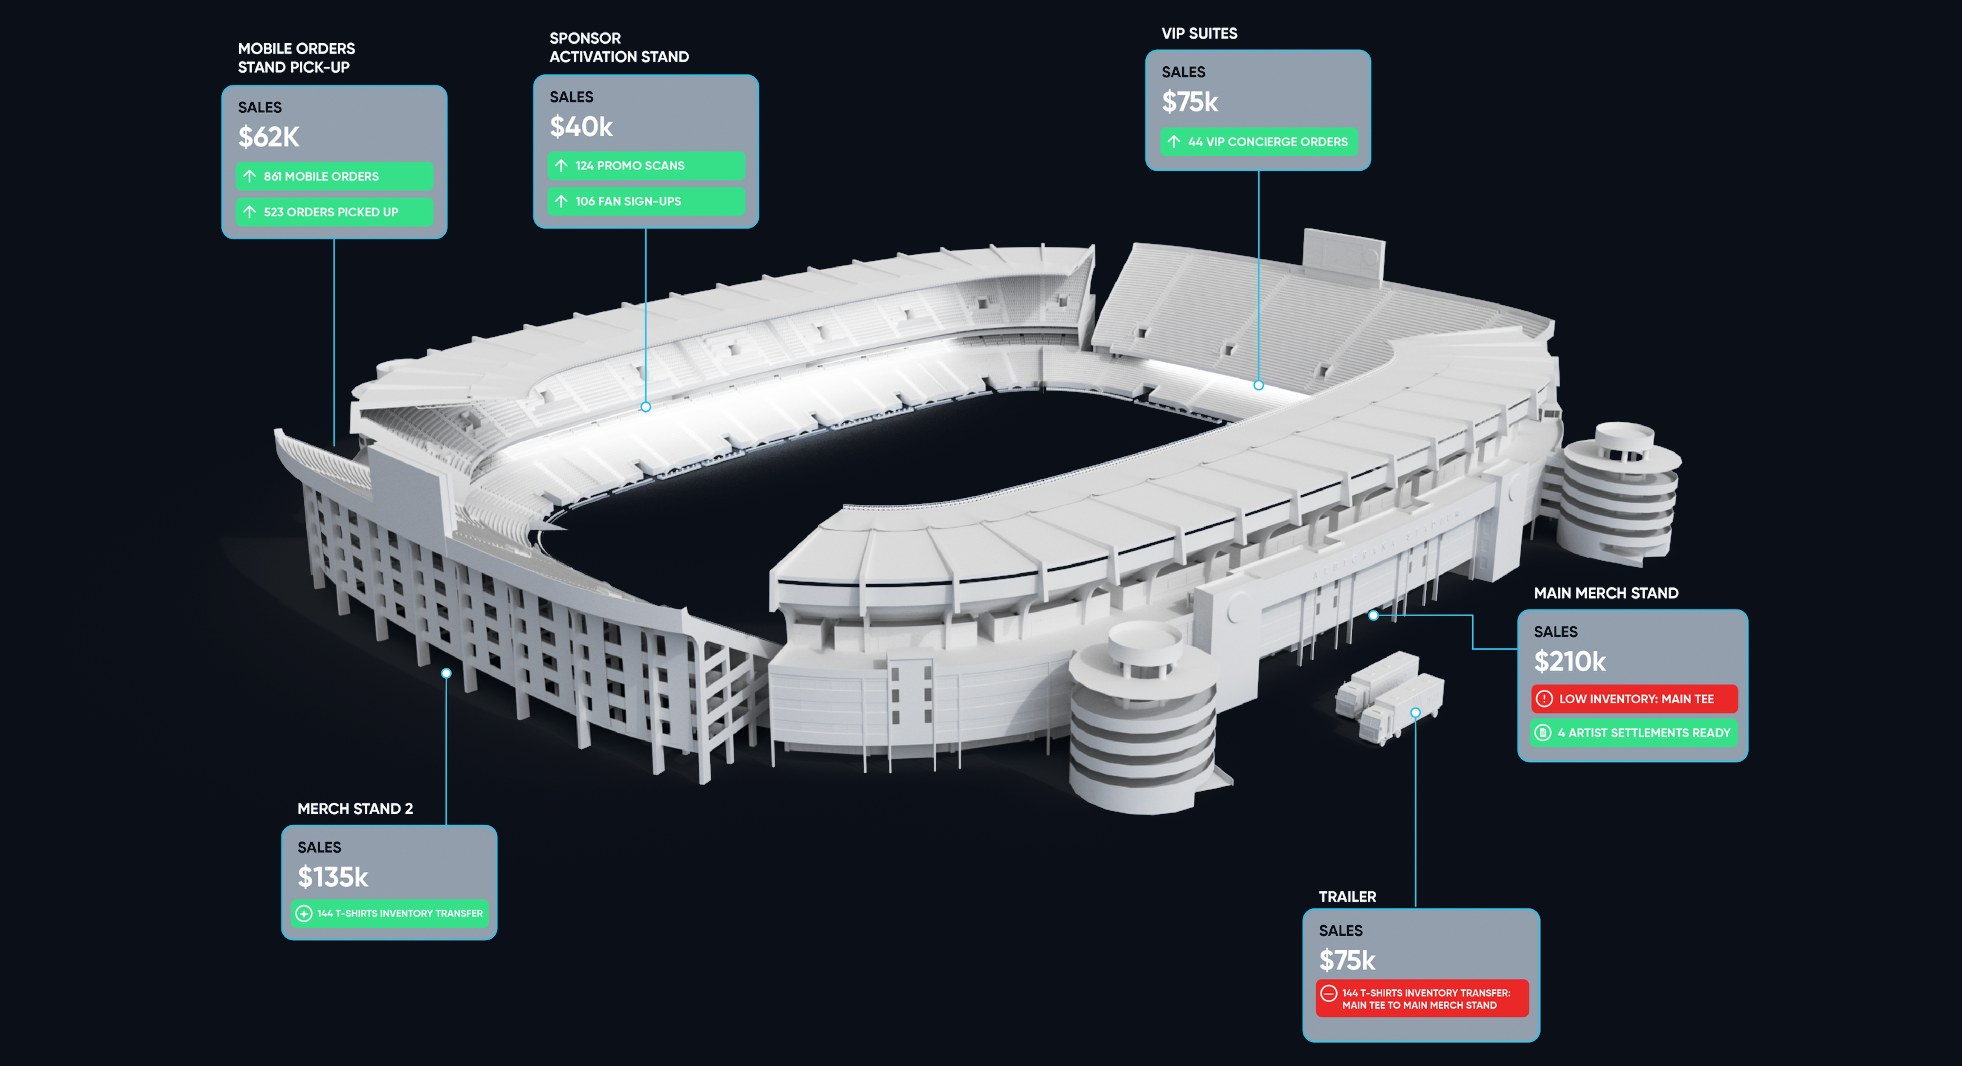
Most merch sells around doors, set changes and the end of the show. Staff for those windows and send handhelds to work the longest lines.

Fans scan a QR code, order in the browser with no app, and pick up or get delivery. Each mobile order also captures fan data.

Suite and club guests rarely leave their seats to stand in line. In-suite ordering and delivery bring the stand to them. Across an analysis of dozens of venues, concierge-assisted orders averaged 7% more per order than VIP purchases at a merchandise stand.

With 63% of gross coming from three items, make sure every stand has the best sellers in every size before you add more styles.

Live counts by stand, item and size, with low-stock alerts, let crews restock or transfer before a top seller runs out at the busiest stand.

Publish the catalog before the show so fans can browse and pre-order, and offer ship-to-home when a size sells out. Sales start before doors and continue after the stand closes.
Mobile ordering, from the atVenu Mobile Ordering brochure 2026
The total-sales figure compares events at venues with and without mobile ordering, and results vary with how many fans use it, so promote it at the gates and from the stage screens. atVenu Mobile Ordering can be used for merchandise and food and beverage items. See how atVenu mobile ordering works.
Measure every show on its own, then compare it with similar nights: the same genre, a similar capacity and a similar selling setup.

$/head, share of fans buying and average order for recent comparable shows.

Add a stand, open mobile ordering or trim the product line, one at a time.

Track sales by stand and hour during the show, and move stock or staff as needed.

Check the result against the baseline at the next comparable show.
$1/head × 5,000 fans = $5,000
At 5,000 attendees, each extra dollar per head adds $5,000 in gross merch sales for that show.
atVenu's merchandise tools show sales and inventory by stand, item and size in real time, and the same data carries into the settlement after the show.
atVenu's Year in Review puts the average at $10.24 per head for 2025, up from $8.79 in 2023, and $10.33 for January 1 to September 30, 2026. Results vary widely by genre and venue size, so compare a show with similar shows rather than one overall average.
About one in five. atVenu's Year in Review shows 20% of fans buying merchandise in 2023 and 21% in 2024, 2025 and 2026 (January 1 to September 30).
Divide total merchandise sales by attendance. You can also read it as the share of fans who buy multiplied by the average spend per buyer, which shows whether to work on reaching more buyers or growing each order.
In atVenu's multi-venue analysis, events at venues using mobile ordering averaged a 22% increase in total sales, and mobile orders averaged a 12% higher order value. Fans order from their phones with no app download, and each order captures fan data.
T-shirts, by far: 56% of items sold in 2025, at an average of $37 before tax. Pullover hoodies, hats, koozies and posters complete the top five, and the top three items produce 63% of gross merch sales.
Not in 2025. Shows under 500 capacity averaged $11.86 per head, up 10%, and shows from 500 to 3,000 capacity grew 15% to 17%. Shows from 3,000 to 5,000 capacity averaged $8.39.
Offer in-suite ordering and delivery so premium guests can buy without leaving their seats. Across an analysis of dozens of venues, concierge-assisted orders averaged 7% more per order than VIP purchases at a merchandise stand.
Published:
September 7, 2026