
Solutions
Industries
Resources
About
Plan merch from attendance: in atVenu's data about 21% of concert fans buy, each purchase averages 2.1 items, and t-shirts are 56% of items sold. Per 100 fans, that points to about 30 to 44 items and 17 to 25 tees, about half of them black. Check the plan against your own count-in and count-out data.
Read time:
10
minutes

Plan merch from attendance: in atVenu's data about 21% of concert fans buy, each purchase averages 2.1 items, and t-shirts are 56% of items sold. Per 100 fans, that points to about 30 to 44 items and 17 to 25 tees, about half of them black. Check the plan against your own count-in and count-out data.
Four numbers turn a ticket count into units: how many people will be there, what share of them buy, how many items each purchase holds, and what share of items each product takes. atVenu publishes the last three from its merch data.
Units of an item = attendance × % buying × items per purchase × item share
This assumes one purchase per buying fan. Some fans buy twice, so treat the result as a floor for your best sellers.
Sources: atVenu Year in Review (artist merch data; share of fans buying, top items and prices); atVenu, The 2025 Fan Spending Report (August 22, 2025; items per purchase).
Two methods give a range for one sold-out night. The high case multiplies the published buying rate by items per purchase. The dollar check starts from what fans at this capacity spend per head and divides by an average item price. Both are illustrations of the method, not a forecast for your band.
Illustrative arithmetic from atVenu's published averages
The high case uses 21% of fans buying (Year in Review, 2025) and 2.1 items per purchase (Fan Spending Report, August 2025). The dollar check uses $10.83 per head for 500 to 1,500 capacity (2025) and about $36 per item, our weighted average of the Year in Review's top 10 items by price and share. The two do not match: the high case implies more spend per head than the 2025 average, so treat it as the ceiling for your best sellers and the dollar check as the base.
Most shows are smaller than a sold-out 1,500. atVenu's average nightly merch revenue for a show under 1,500 capacity was $6,342 in 2024, which at $10.83 per head is about 585 fans (our arithmetic). That is why the per-100-fans line is the one to scale. For a 10-date run of sold-out 1,500-capacity rooms, the range is about 2,500 to 3,700 tees before any buffer. Decide the buffer per item, carry depth on the few items that sell out, and lean on ship-to-home for the rest.
Spend per head, and the t-shirt price that sells best, both change with the room. Multiply the per-head figure by your expected attendance to size the night in dollars, then convert dollars to units with your own prices.
Sources: atVenu Year in Review 2025 (average $/head by capacity grouping, per attendee); atVenu, What T-Shirt Price Makes Artists The Most Money On Tour (February 2024, 2023 data from over 90,000 shows). Gross per 1,000 attendees is our arithmetic.
Genre moves the plan even more than capacity. In 2025, K-Pop shows averaged $34.52 per head and Country $8.46, so a K-Pop date of the same size can bring in about four times the merch dollars. Check your genre on the Year in Review before you set quantities.
Black, by a wide margin: just over half of all t-shirts sold in 2025 were black, and white was a distant second.
Share of t-shirts sold by color, 2025
Bars are drawn to scale from zero. "All others" combines blue, navy, baby blue, multi, brown and other (our sum of the listed shares).
Source: atVenu Year in Review 2025, top t-shirt colors of 2025.
For sizes, atVenu's last published read was its 2019 data, when medium and large were tied as the most common sizes on the top-selling black tee. Your own audience is the better guide, and it is already in your count sheets. Read them like this after every show:
Sold = count in + adds − comps − count out
Run it by item and size across your last several shows. A size that keeps finishing at or near 100% sell-through was short; reorder to the size shares you actually sold.
Fewer than most tours carry. In atVenu's data the top three items have taken a growing share of gross merch sales, and longer product lines have not earned more per head.
Share of gross merch sales from the top three items
Bars are drawn to scale from zero. In 2024, the top three items made 69% of gross sales for pop artists and 56% for country.
Sources: atVenu, A Larger Product Line Doesn't Make You More Money (January 2022; 2019 and 2021 data); atVenu, What Are The Top Selling Items For Your Genre in 2024? (May 2024); atVenu Year in Review 2025.

At 5,000 to 10,000-capacity venues, artists with 15 or more items averaged a lower $/head than artists with fewer items, and the pattern held for every capacity group under 20,000.

atVenu's 2026 outlook: smaller, curated assortments are outperforming larger catalogs, with higher per-head spend and faster decisions at the table.

The average tour product line fell from 17 items in 2019 to 13 in 2021, partly because of material shortages and shipping limits, and average $/head still rose from $5.54 to $8.47.
Even so, the largest group in atVenu's 2025 count of unique items brought into a show was 15 or more items, at 41%. If that describes your line, the top-items list is a good place to start trimming:
Source: atVenu Year in Review 2025, top selling items of 2025.
The buying rate is similar, but you share the table. atVenu's analysis of 650+ festivals in 2025 found about 21% of fans purchasing merch, with average fan merch spend holding at around $67, as published. About 70% of all merch sales at festivals are festival merchandise, so artist merch sits beside the festival's own line.
Source: atVenu, How Festivals Are Adding Revenue in 2026 (March 1, 2026; 650+ festivals analyzed).
Festival fans who buy were also picking up more items in atVenu's 2024 festival data: 1.8 on average, up from 1.3 in 2023, helped by add-ons like koozies, posters, tote bags, bandanas and stickers. Keep accessories close to the register, and use atVenu's auto-advancing to send your line to the festival before you arrive.
The sale does not have to end. With atVenu's Ship to Home, the register keeps taking orders for sold-out items and sizes, fans pay on the spot and add a shipping address by text, and you produce only what was sold. That lets you carry less of the long tail without missing demand.
40,000-capacity festival with 80 plus artists; atVenu case study, February 2019
In 2015, merch ran from a basic tent with shirts on the wall and a spreadsheet for sales, inventory and artist settlements.
atVenu showed the hot sellers on day one, so the team printed more in time for the last two days. Historical data then set stock for four stands, and Ship to Home covered anything that still sold out.
Merch revenue rose 120% in the first year on atVenu, and Ship to Home added 10% more sales.
Source: atVenu, BottleRock Doubles Merch Revenue with atVenu (February 7, 2019).
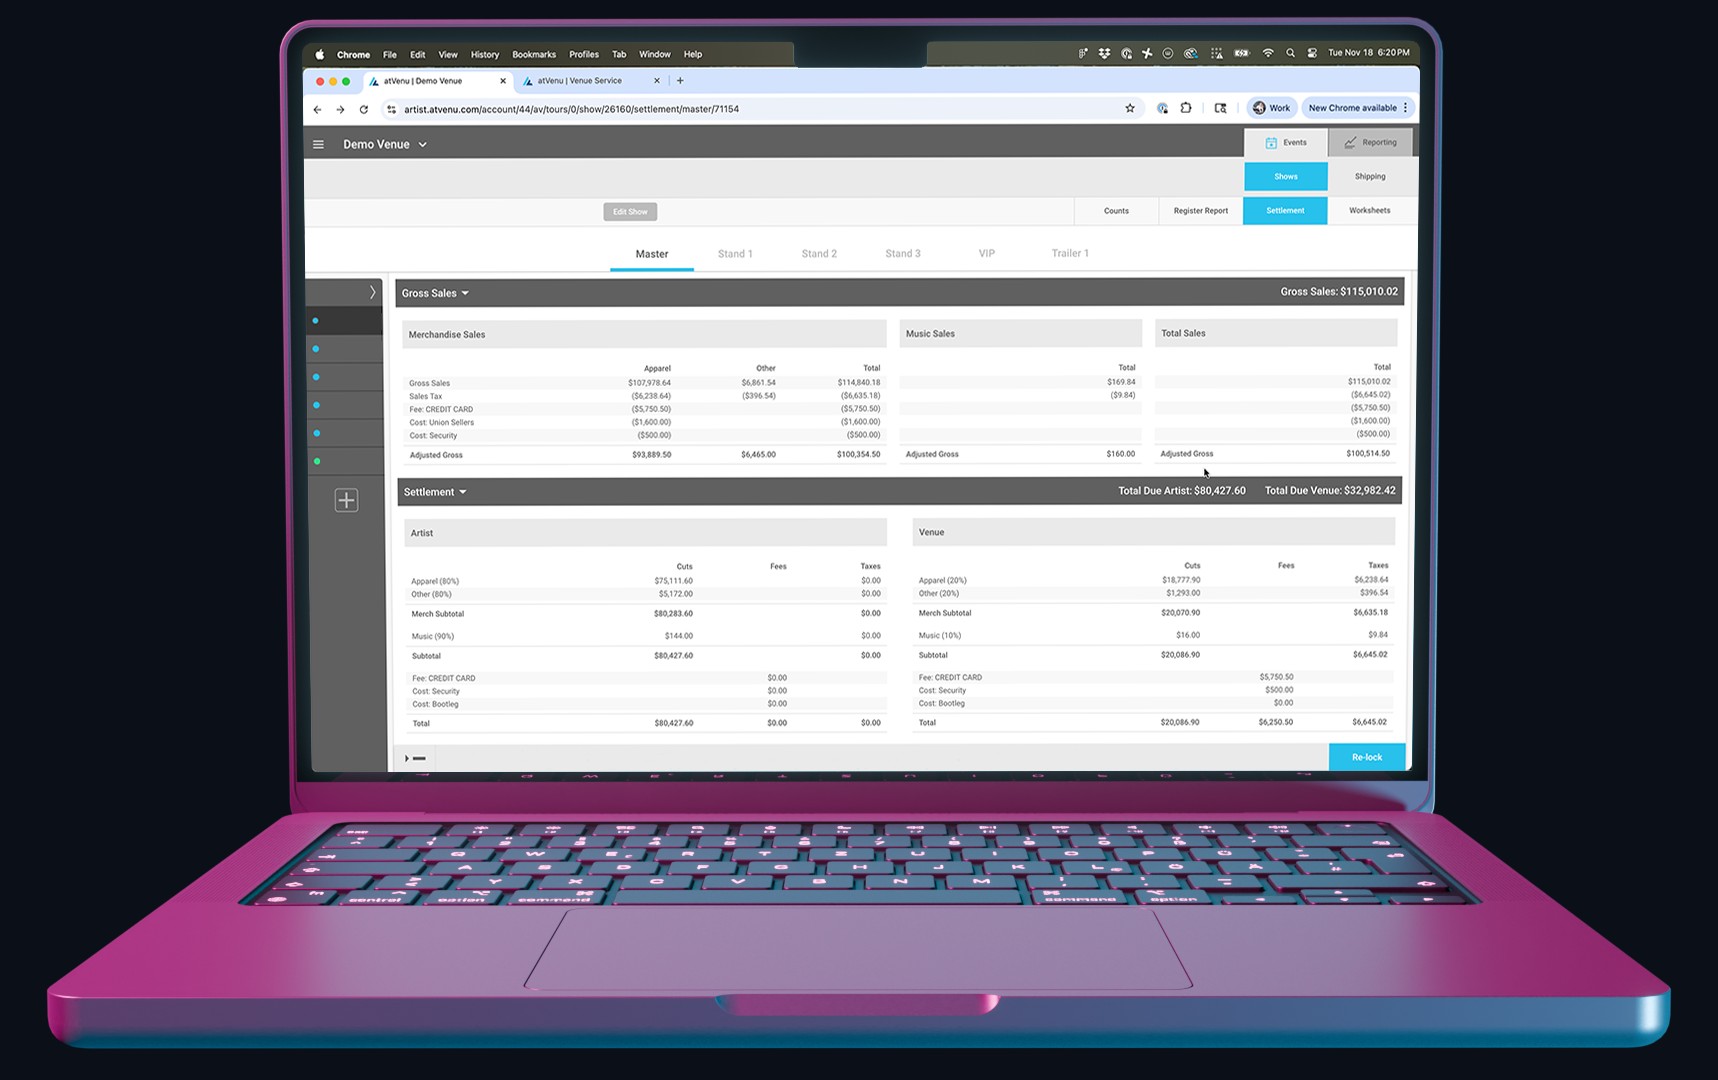
Count every night, digitally, and let the totals roll up by tour. That is what turns one show's guess into the next order's plan.

Record ins, adds and comps for every item and size before doors.

The register sells from that count, so stock updates with every sale.

Count out, settle with the venue digitally and send the reports the same night.
Compare sizes and items across shows to find what ran short.

Move stock from warehouse to trailer to show before a best seller runs out.
Project what you will run out of, when, and how much to order.
atVenu's tour merch tools do each step: count sheets, auto-calculated settlement sheets, trailer and warehouse inventory, forecasting of sell-outs by city and date, and a historic record of every show's ins, adds, comps and outs.
Start from attendance. atVenu's published averages point to about 17 to 25 t-shirts per 100 fans: the lower figure comes from 2025 spend per head, the higher from 21% of fans buying 2.1 items each, with t-shirts at 56% of items. A sold-out 1,500-person show works out to about 250 to 370 tees. Multiply by similar dates, then adjust with your own sell-through.
Use spend per head for your capacity group. In atVenu's 2025 data it ranged from $8.39 per attendee at 3,000 to 5,000 capacity to $11.86 under 500, or about $8,390 to $11,860 in gross sales per 1,000 attendees. Convert those dollars to units with your prices.
Medium and large: atVenu's 2019 data found them tied as the most common sizes on the top-selling black tee. Your own count-in and count-out data is the best guide; reorder to the size shares you sold, and add depth where a size keeps selling out.
Black. In atVenu's 2025 data, 51.83% of t-shirts sold were black, followed by white at 12.57% and natural at 5.22%.
Fewer than most tours carry. The top three items made 63% of gross merch sales in 2025, and atVenu found that artists with 15 or more items averaged a lower $/head than artists with fewer items at venues under 20,000 capacity.
About 21% in atVenu's 2025 data and from January 1 to September 30, 2026. atVenu's 2025 festival analysis also found about 21% of festival fans purchasing merch.
Units sold divided by units available. Units sold are count in plus adds, minus comps, minus count out; units available are count in plus adds. Track it by item and size for every show.
Published:
July 5, 2026