Solutions
Industries
Resources
About

Access, frequency, and measurable moments — not just higher prices — are driving growth. Every year, we analyze transaction-level data across 100,000+ live events to understand what’s actually happening on site — what fans are buying, when they’re buying, and how operational decisions shape revenue.
March 1, 2026
Read More
VIP Guests Shouldn’t Be in LinesHow premium merch is becoming hospitality, not a transactionVIP guests don’t want to think about logistics.They want the night to feel uninterrupted — effortless — like everything just works.One of the clearest patterns we saw across venues this year wasn’t about pricing or product.It was about time.
February 3, 2026
Read More
When a stadium becomes a concert venue for one night, everything changes.Operations that normally run smoothly for a sporting event suddenly need to scale to touring demand. Merchandise teams must move inventory across dozens of locations. Lines surge in waves. Fans arrive all at once. And there is only one opportunity to get it right.
January 7, 2026
Read More
As 2025 wraps up and before our full Industry Year in Reviews drop in January, we're sharing an early look at the questions we’ve been digging into across artists, venues, sports, and festivals — and the patterns that showed up most consistently.
December 15, 2025
Read More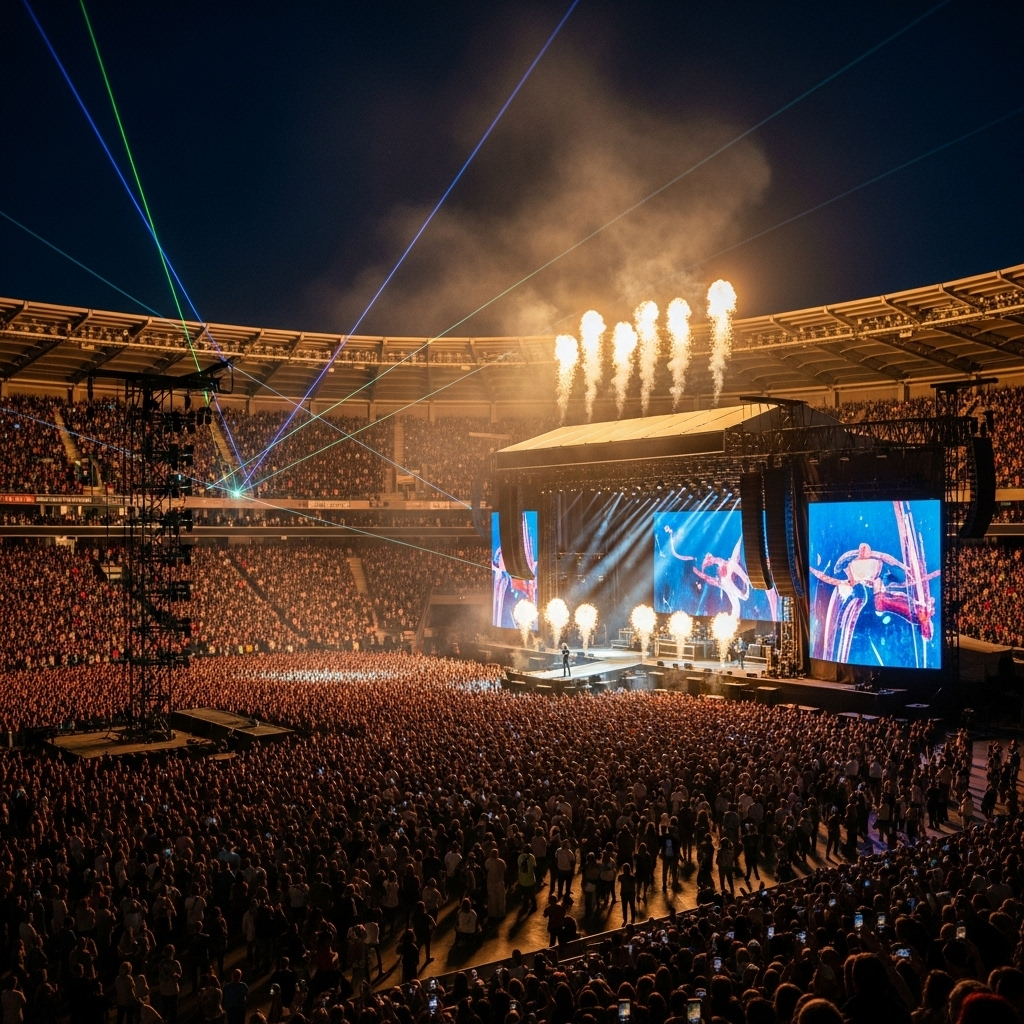
The first half of 2025 showed one clear theme: fans are still showing up ready to spend—and venues that make it easy to buy are capturing more revenue than ever.
September 6, 2025
Read More.png)
As fall approaches, we’re excited to share a first look at fan spending at concerts, focusing on merchandise, food, and drink sales. By breaking down spending by genre and attendance, we’re revealing the top trends of 2025 so far. Let’s dive in!
August 22, 2025
Read More.png)
Discover how mobile ordering increases merch sales by up to 25%, reduces lines, and improves fan experience at arenas and stadiums
June 1, 2025
Read More
Looking for the best event POS system? atVenu is the all-in-one platform trusted by 125,000+ events for fast transactions, real-time insights, mobile ordering, and more.
January 1, 2025
Read More
Sponsorship in live events is evolving. It’s no longer enough to simply display a logo on a concourse banner or scoreboard. Sponsors expect measurable engagement and clear returns on their investment—and venues are responding by weaving sponsor activations directly into the fan experience and the point of sale.
November 6, 2024
Read More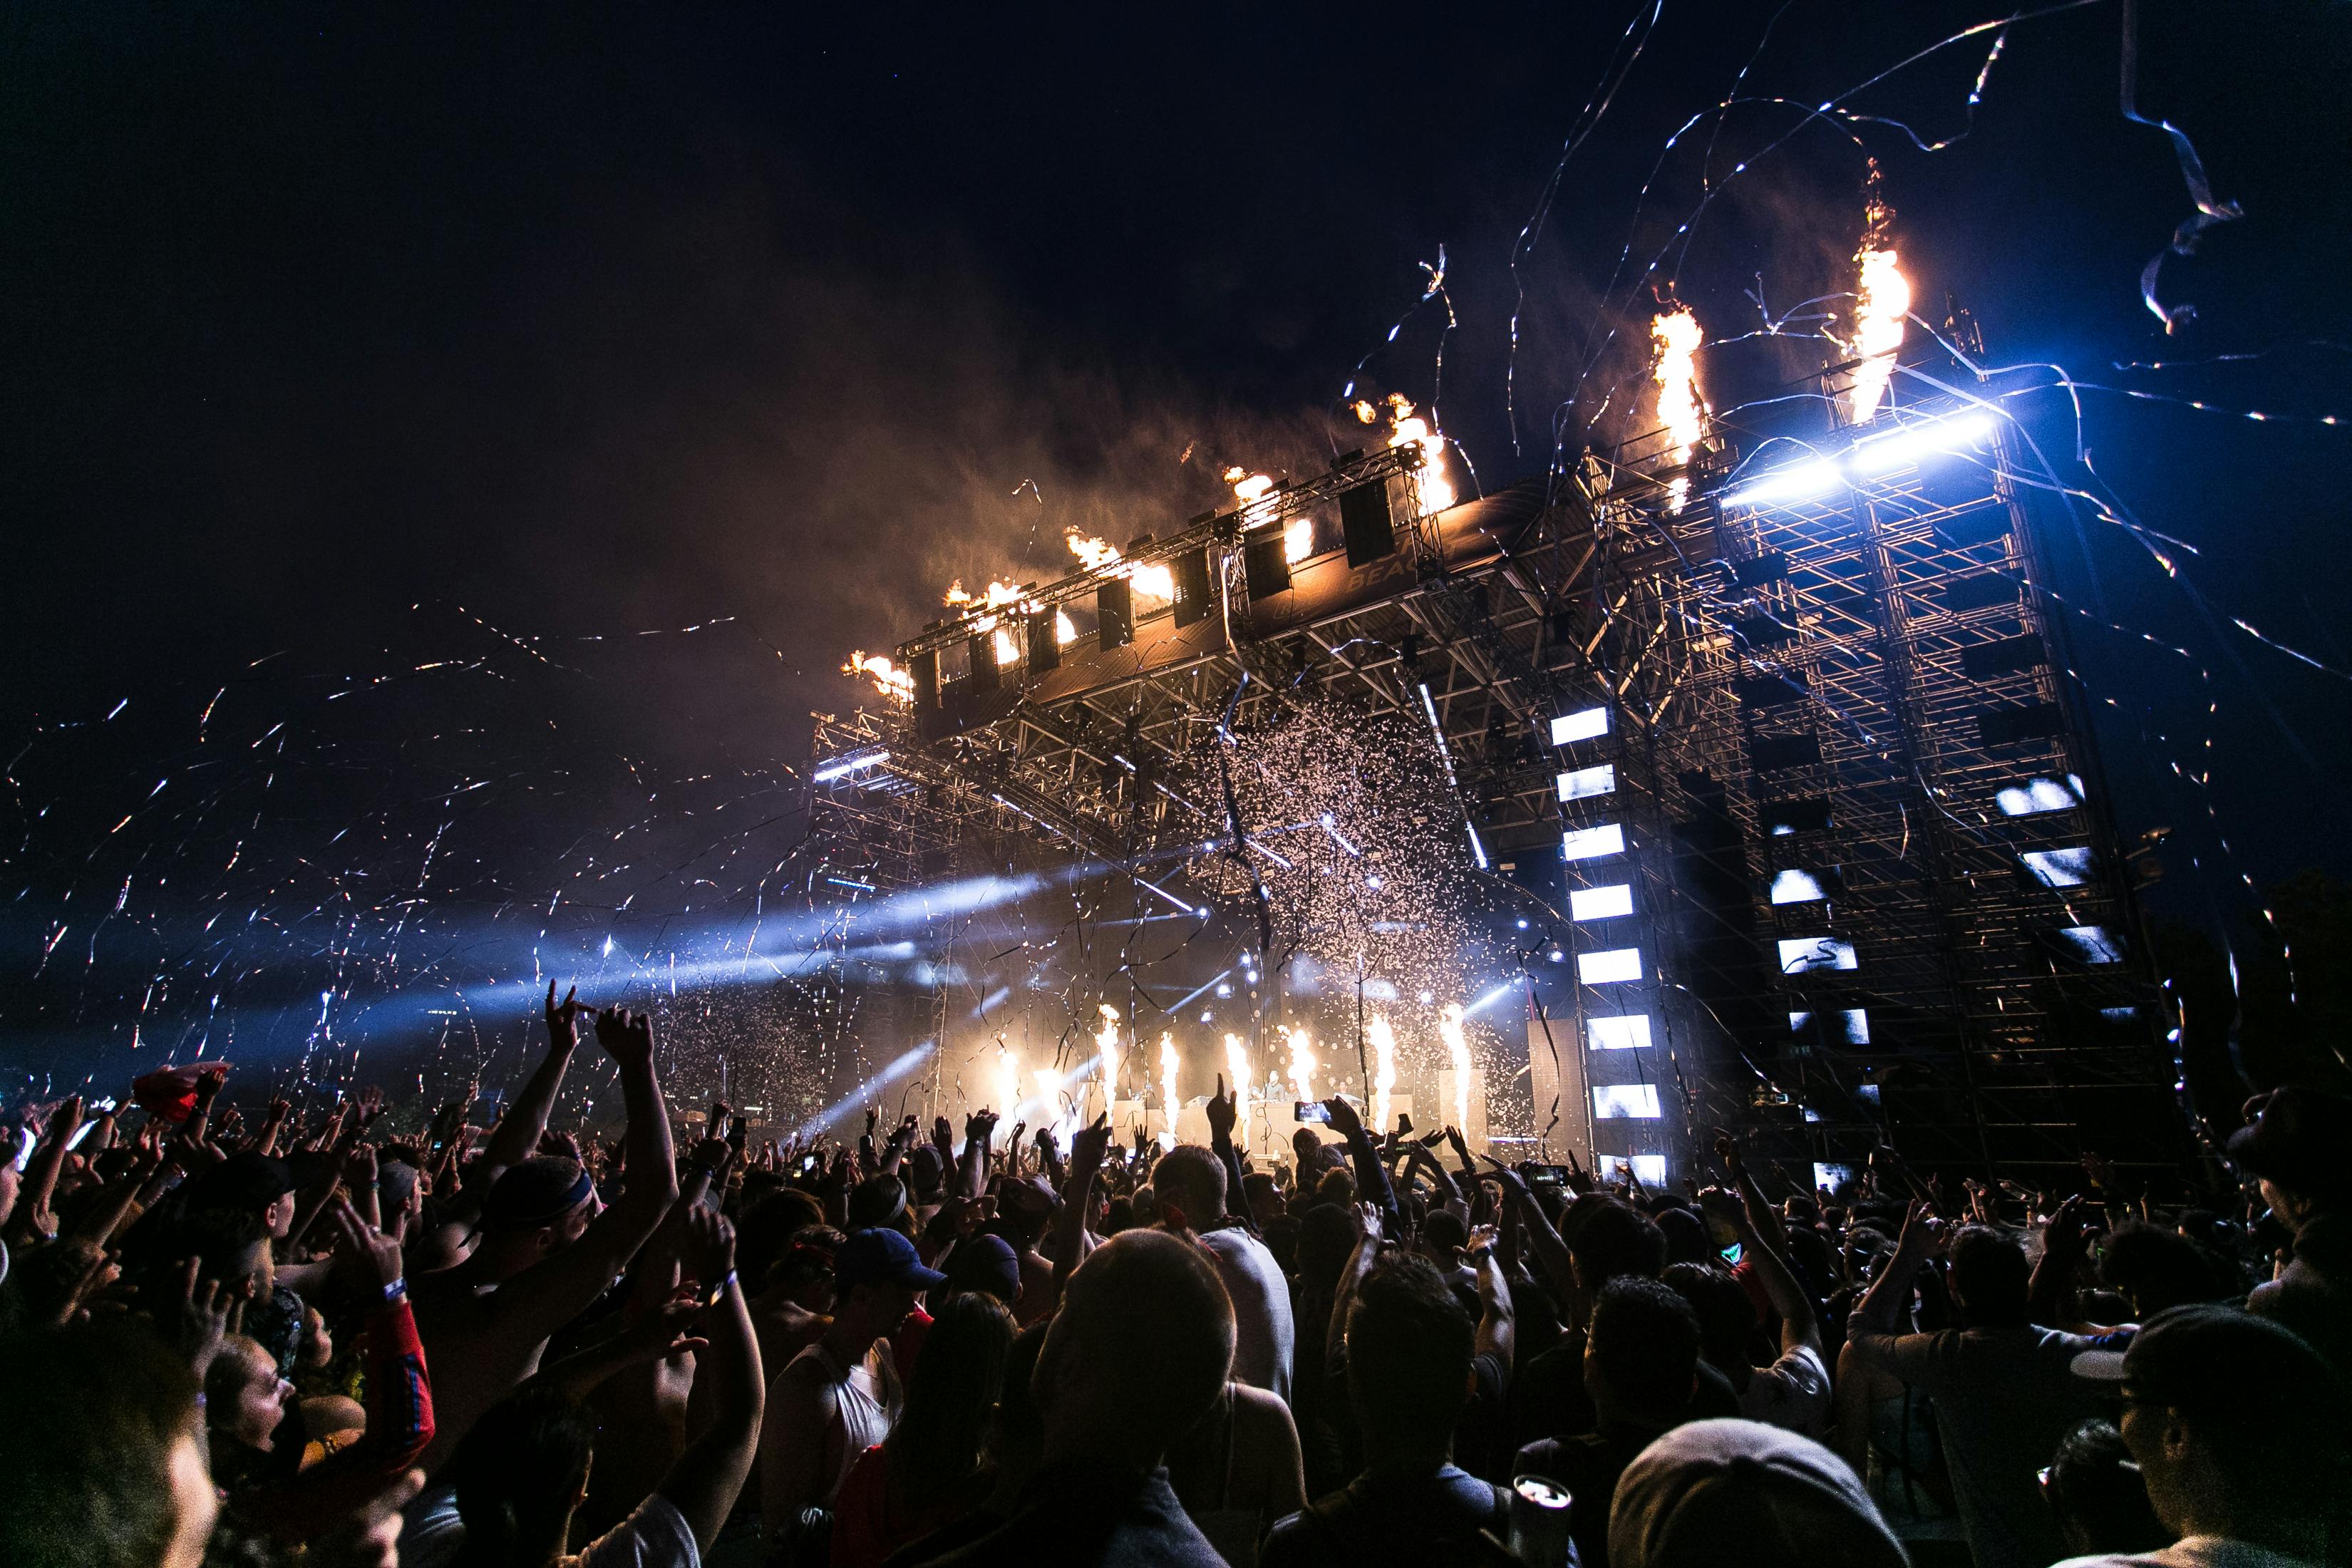
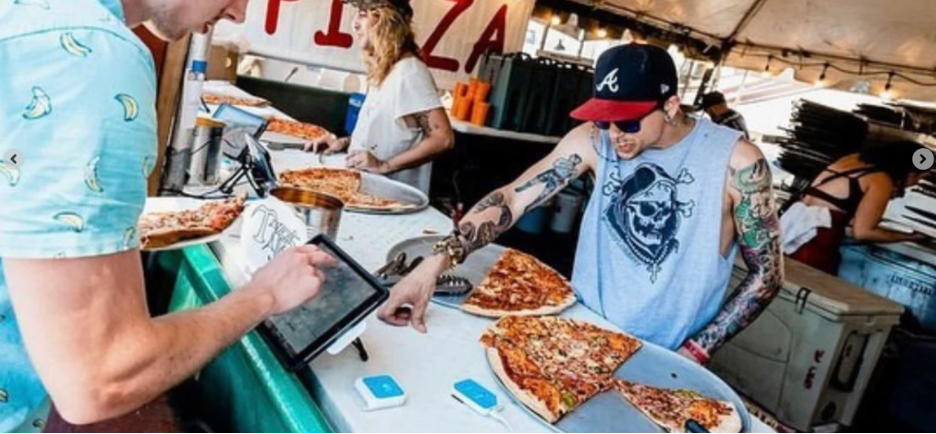
A true festival point-of-sale system has to do more than take payments. It has to keep lines moving during peak rushes, handle intermittent connectivity without stopping sales, support merchandise and food at the same time, and give operators a clear view of what’s happening across the entire event while it’s still happening.
November 3, 2024
Read More.jpeg)
September 3, 2024
Read More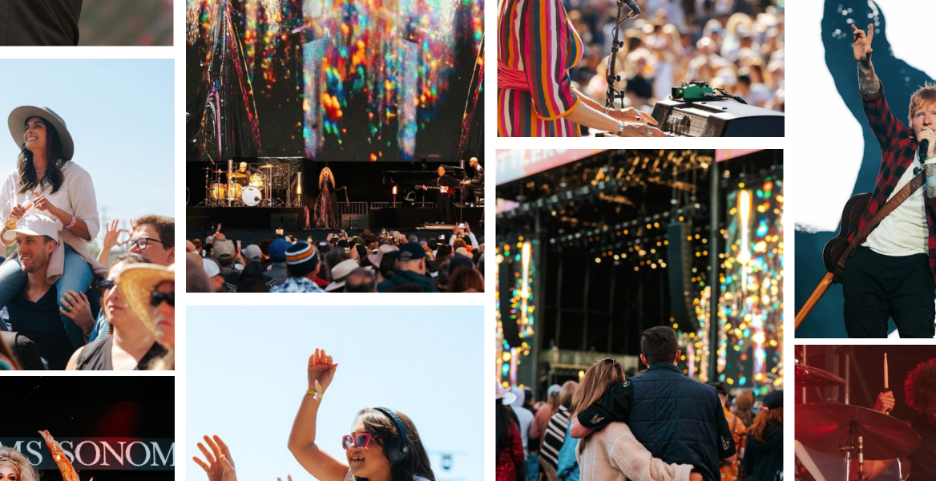
Festival season is here, and we're diving into the 2024 festival merchandise trends. We explore fan attendance and how fan spending has changed by the genre and size of festivals, as well as highlight new merchandise items to consider adding to your product line. Let's get started!
July 15, 2024
Read More
In the fast-paced environment of festivals, a reliable point of sale (POS) system is essential. It streamlines operations, boosts sales, and enhances the attendee experience. Here’s why the right POS is critical and why atVenu is the best choice and the most trusted festival cashless payment system.
July 6, 2024
Read MoreJune 11, 2024
Read More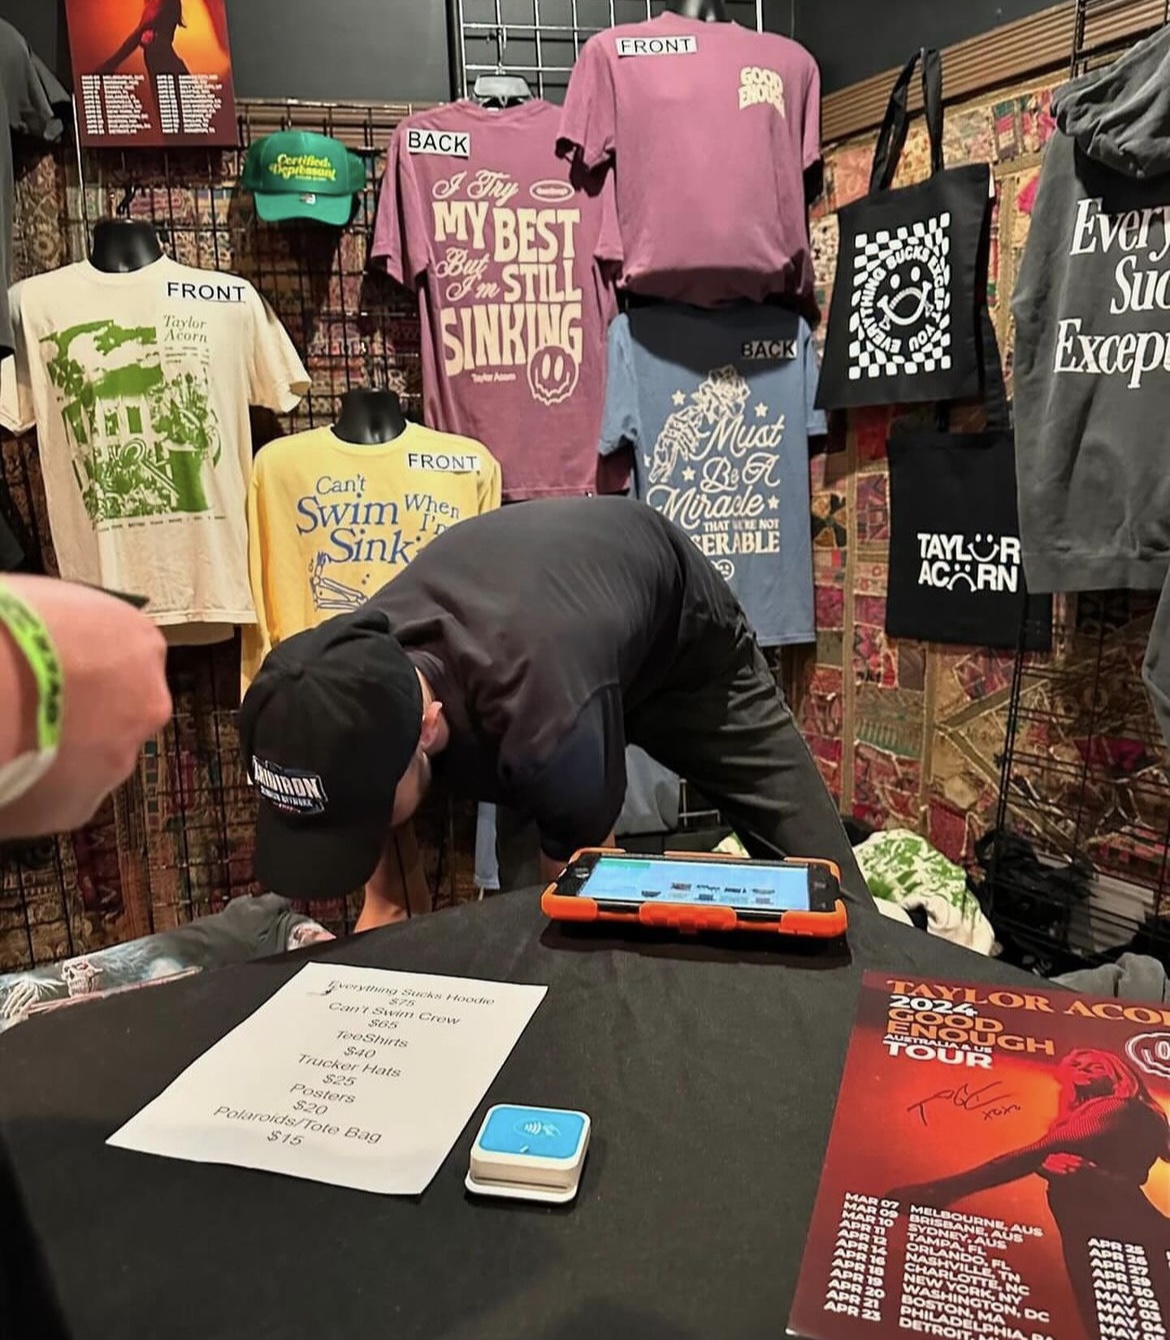
We take a look at the top selling items for pop, rock, alternative, country and hip-hop/rap. Looking at the top 3 selling items, what percentage of an artist's overall Gross Merchandise Sales do they make up?
May 27, 2024
Read More
We're sharing early insights on 2024 artist merchandise trends, including average revenue per person by genre and capacity grouping, as well as trends in concert attendance compared to prior years. See how attendance has changed in 2024 and if has impacted your genre and capacity grouping.
May 27, 2024
Read More
Sponsors are looking for more than just the promise of impressions. The challenge is to provide fans with an exceptional experience while guaranteeing sponsorship visibility. This is where atVenu's promotion and discount features come into play. We share insights into how discounts can benefit fan spending and your sponsors.
April 18, 2024
Read More

.jpeg)